New Study Reveals Discrepancies Between GWAS and LoF Burden Tests in Trait-Specific Gene Prioritization
November 6, 2025
Two conceptual rankings are defined: trait importance (squared effect size) and trait specificity (relative importance across all relevant traits), explaining why methods favor certain genes or variants.
The average GWAS strength for a trait-specific variant scales with alpha_1^2 divided by the sum of alpha_t^2 across traits (Psi_V), with non-coding regulatory context contributing to divergence from LoF-burden results.
Random drift affects allele frequencies (MAF) and GWAS rankings, causing strong trait-important variants to sometimes dominate unrelated traits; burden tests mitigate this through aggregation within genes.
GWAS and LoF burden tests prioritize genes and variants differently, yielding discordant but complementary insights into trait biology.
Burden test enrichment for trait-specific genes arises because the Burden z^2 scales with gamma_1^2 p_LoF(1-p_LoF), tying p_LoF to selection, mutation rate, and gene length, which links burden to trait specificity rather than pure trait importance.
LoF burden strength scales with gene-specific LoF burden and gene length, so longer genes show stronger signals largely due to more potential LoF sites and smaller standard errors, biasing toward trait-specific genes.
GWAS prioritize trait-specific variants (Psi_V), shaped by variant context such as tissue-specific expression and regulatory surroundings, including non-coding variants with context-dependent effects.
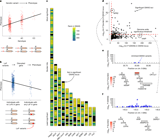
Using 209 quantitative UK Biobank traits, the study shows limited overlap between top burden genes and top GWAS loci, illustrated by examples like NPR2 versus HHIP.
A framework is proposed to estimate trait importance and specificity, with implications for drug target discovery and trait biology, highlighting that GWAS and burden tests are complementary rather than interchangeable.
Summary based on 1 source
Get a daily email with more Science stories
Source
Nature • Nov 5, 2025
Specificity, length and luck drive gene rankings in association studies