Prometheus 3.0 Upgrade Breaks Legacy Histogram Alerts with Decimalization Change
November 3, 2026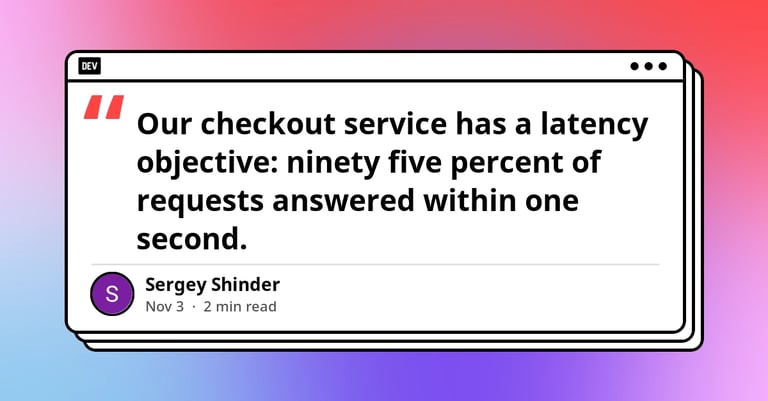

Prometheus 3 normalizes classic histogram le labels upon ingestion, causing buckets with whole numbers to be stored with a decimal and breaking existing selectors in alerts and dashboards that expected le="1".
Upgrading Prometheus from 2.53 to 3.0 changed histogram le label normalization, turning le="1" into le="1.0" and breaking an alert that calculated latency as the ratio of the le="1" bucket to all requests.
To prevent future issues, the author suggests validating rule expressions against a copy of the new version with the same scrapes prior to upgrading to ensure data is returned for both numerator and denominator.
The latency objective was 95% of requests answered within one second, and an alert failed to fire when a slow fraudulent check pushed a fifth of checkouts over one second for about two hours on a Saturday afternoon.
The alert expression stopped firing because the selector le="1" matched no series after the upgrade, and a division with no data yields no result, resulting in a non-firing alert for three weeks.
Panels and rules were updated to name le="1.0" in the new version, and a workaround used a regular expression to match both le="1" and le="1.0" for historical data.
Go-based clients generated le="1" (no decimal) while Python services already produced le="1.0", leading to inconsistent behavior across services and missed alerting after the upgrade.
Observation: an upgrade can preserve metrics but still rename a critical value an alert depends on, specifically the decimalization of the le label in this case.
Summary based on 1 source
Get a daily email with more Tech stories
Source
DEV Community • Nov 3, 2026
We upgraded Prometheus and our latency alert stopped matching the bucket it was written for